Microsoft Power BI now empowers millions of professionals to transform raw data into actionable insight. In 2025, Microsoft reports that Power BI is central to its Fabric data ecosystem, delivering AI-assisted analytics through Copilot for Power BI, DirectLake mode, and Fabric OneLake integration.
If you’re wondering how to get the most out of these new capabilities, this guide explains how to use Power BI effectively in 2026, using Microsoft’s own best-practice recommendations.
Executive Summary
- Power BI is part of Microsoft Fabric, enabling end-to-end data analysis from ingestion to visualization.
- Copilot in Power BI lets you build reports and DAX measures with natural-language prompts.
- DirectLake storage mode provides instant access to large datasets without refresh delays.
- Microsoft’s guidance emphasizes governance, adoption metrics, and performance optimization as core success factors.
What makes Power BI the most effective BI platform in 2026?
Power BI continues to dominate due to accessibility, cost-efficiency, and Microsoft integration.
According to industry reports, Power BI’s market share in the BI space exceeds 30%, surpassing Tableau and Qlik.
Power BI delivers:
- Integration: Unified data access via Fabric’s OneLake, connecting Azure, SQL Server, Dataverse, Microsoft 365 and Excel.
- Affordability: Entry-level Pro licenses start around $14/user per month.
- Continuous Innovation: Monthly feature drops keep it future-ready, including Copilot and new AI visuals.
- Self-service BI through Power BI Desktop and Power BI Service.
- Enterprise grade scalability in Power BI Premium capacity.
At HAKO IT, we see companies succeed fastest when they connect Power BI directly to business objectives — not just data sources.
➜ More Info: What is Power BI?
Microsoft describes Power BI as the bridge between business users and data professionals, empowering both to collaborate in the same workspace, with shared semantic models and lineage tracking.
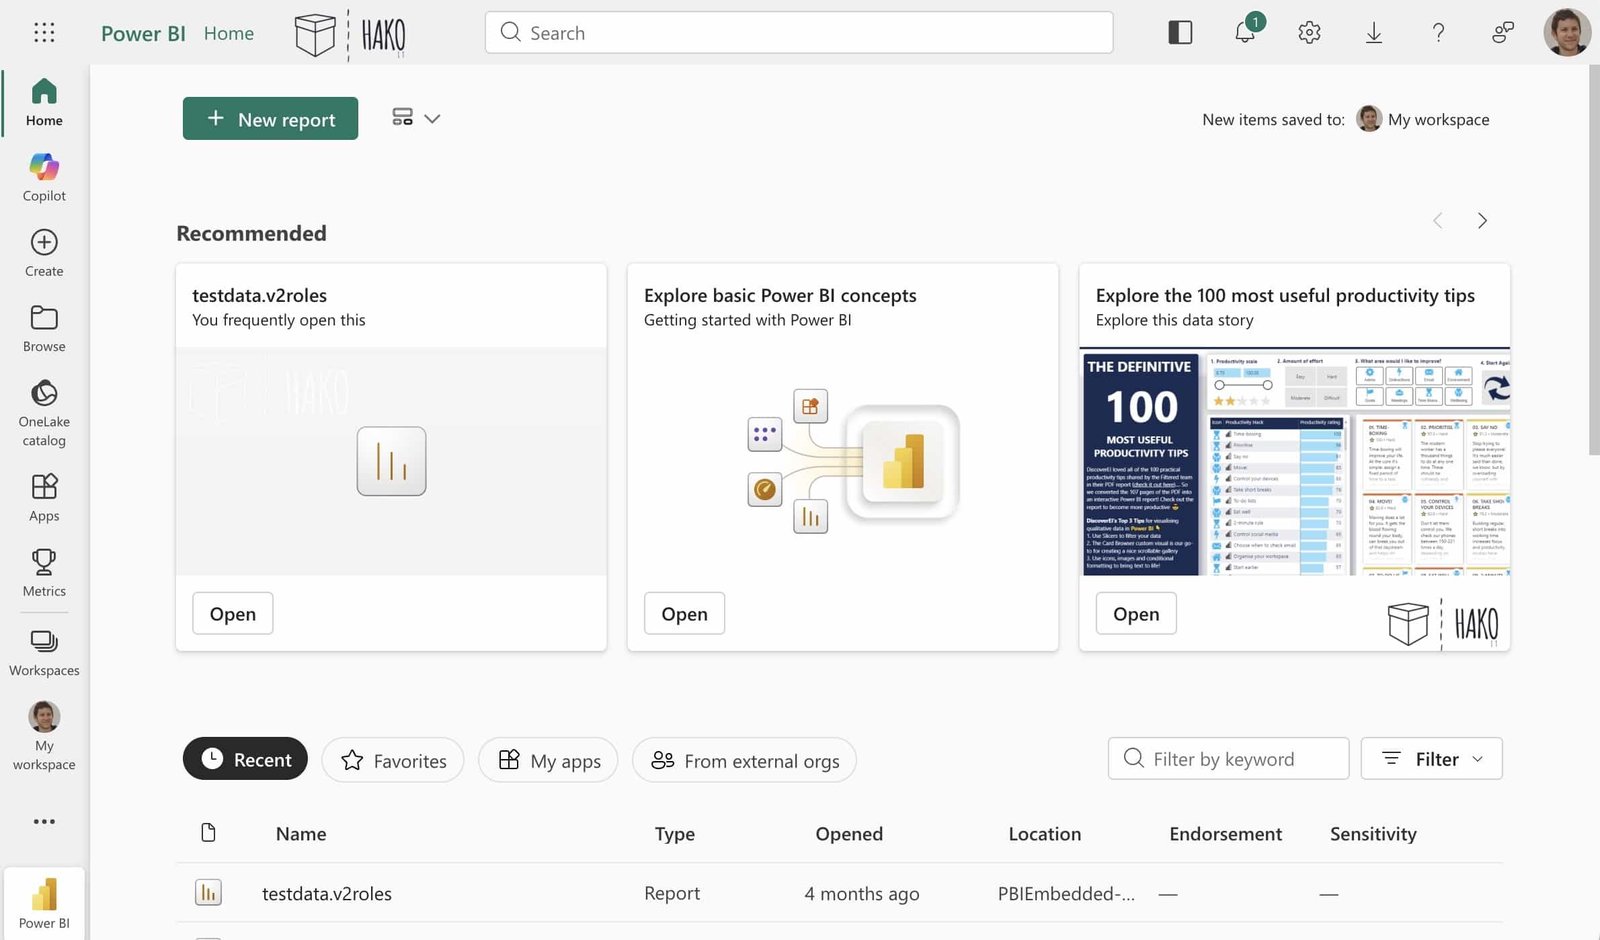
Evolution of AI in Power BI (2026): Copilot, Q&A, Fabric IQ, and Autonomous Agents
Microsoft Power BI continues its rapid transformation in 2026 with major AI-driven updates that accelerate report creation, improve data governance, and unlock deeper analytical intelligence across Microsoft Fabric. Below is an SEO-optimized overview of the latest AI innovations in Power BI.
AI Advancements in Power BI: Copilot, Q&A, and Automated Insights
In 2026, Power BI integrates several next-generation AI capabilities designed to streamline analytics and empower every business user:
1. Copilot in Power BI and Microsoft Fabric
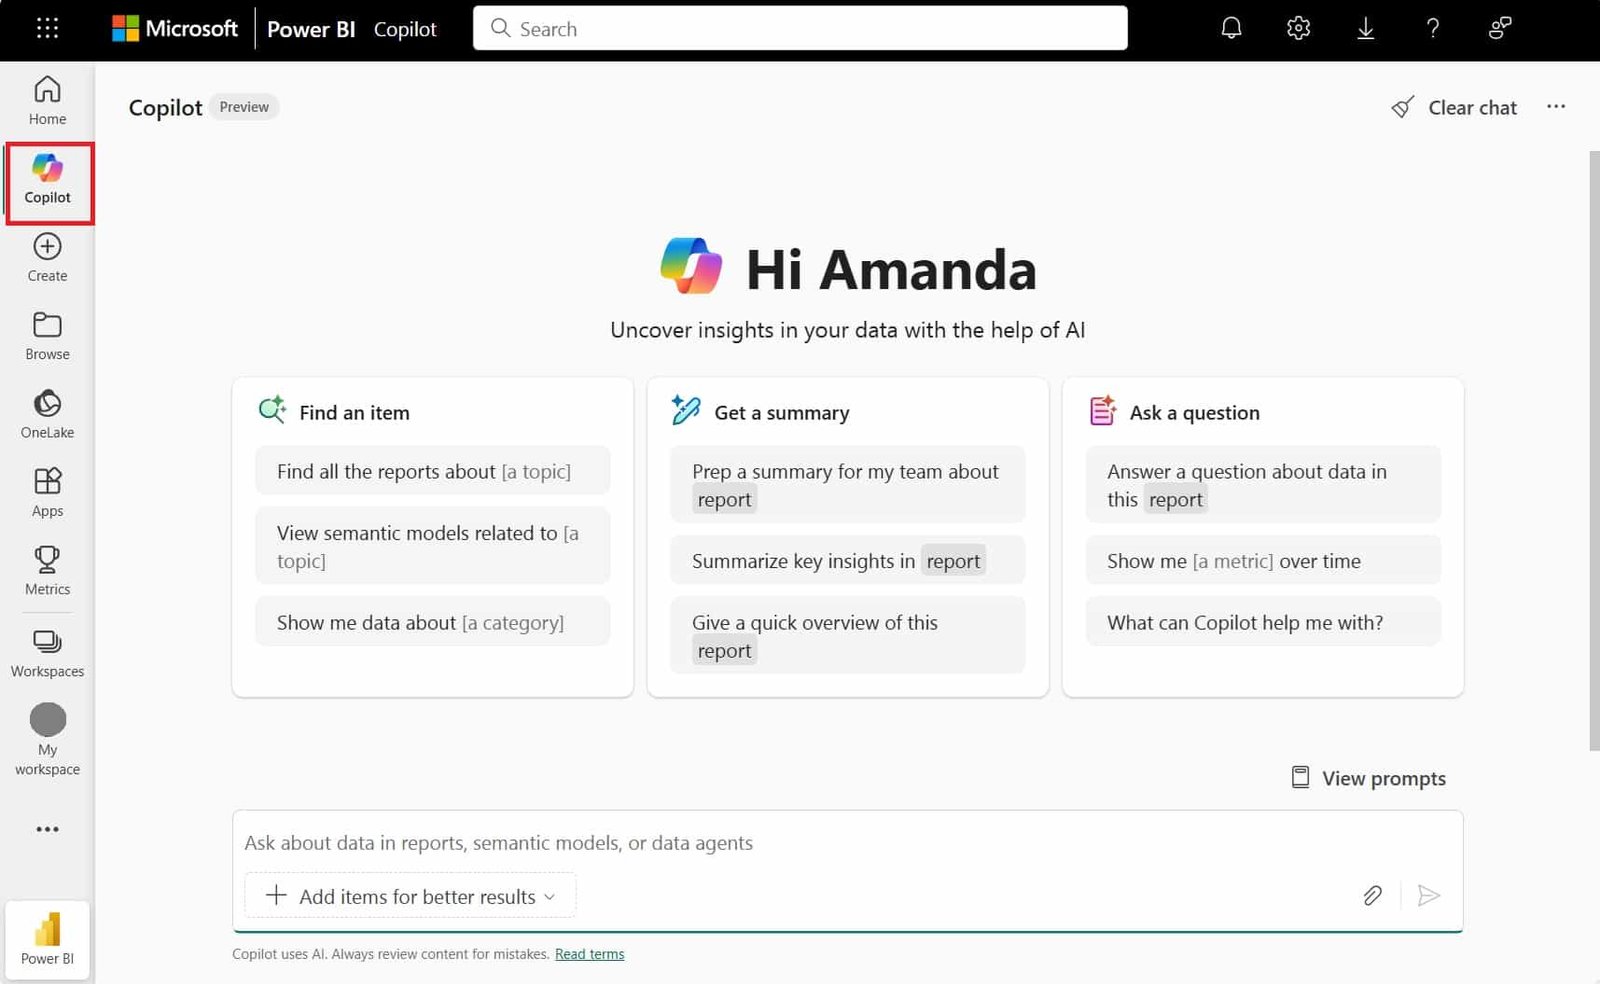
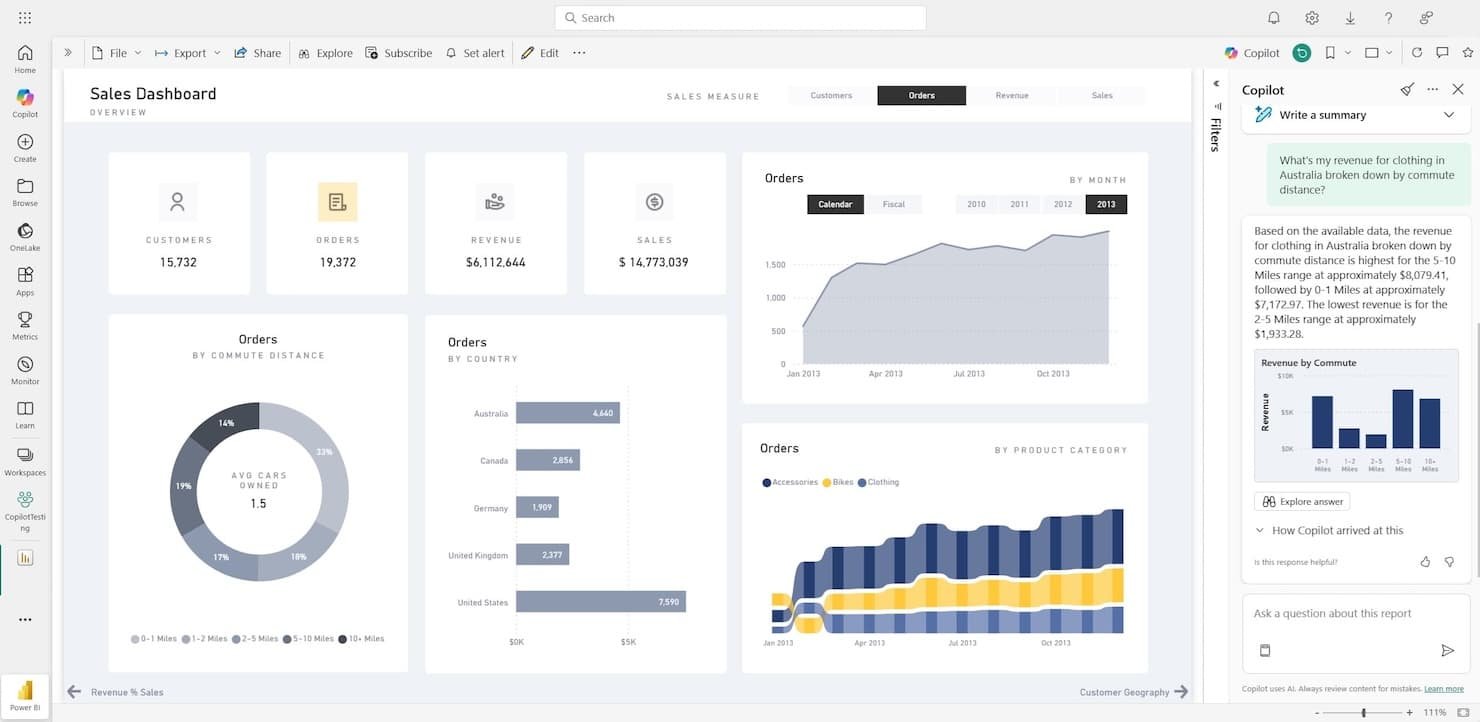
Copilot can now generate reports, DAX measures, queries, and insights from natural language.
- General availability in Power BI
- Expanding across additional Fabric workloads
- Ideal for users without deep DAX or modeling expertise
2. Copilot in Power BI Desktop
A new Copilot panel in Desktop assists with:
- Visual suggestions
- Report optimization
- Automated DAX and query generation
- Natural language–driven report creation
3. Enhanced Smart Narratives
More advanced text explanations for KPIs and metrics, enabling faster executive-ready reporting.
4. Improved Visual Q&A
More accurate and configurable natural language queries with broader data understanding.
5. Fabric IQ: The New Unified Semantic Layer
Fabric IQ extends the Power BI semantic model across the entire business, enabling Copilot and AI agents to reason over enterprise data with consistent business context.\ This results in:
- Better governance
- Higher accuracy
- More intelligent AI responses across workloads
The result: faster development cycles and democratized analytics for all employees.
➜ References: Microsoft Ignite 2025
How Power BI’s AI Evolves in 2026: Agents, Copilot, and Organization-Wide Intelligence
Microsoft expands beyond classic analytics with AI agents that understand, secure, and reason over enterprise data.
1. Agent 365: The Control Plane for Corporate AI Agents
Agent 365 centralizes governance across:
- Microsoft Defender
- Entra
- Purview
- Microsoft 365 apps
It provides unified:
- Access control
- Logging
- Security
- Monitoring
Agents can now safely use Fabric and Power BI data with full enterprise compliance.
2. Foundry IQ: Managed Knowledge for Advanced Agentic RAG
Foundry IQ acts as a curated knowledge layer that enhances agent grounding, connecting to:
- Fabric IQ
- SharePoint
- Microsoft data estates
It uses agentic RAG (iterative retrieval, planning, synthesis) while respecting permissions — ideal for advanced “chat with your data” scenarios far beyond classic Q&A.
3. Work IQ: Enhanced Intelligence for Microsoft 365 Copilot
Work IQ now includes:
- Conversational memory
- Better reasoning over SharePoint metadata
- Improved context fusion between files, meetings, and analytical datasets
This allows Copilot to combine operational content and analytical data for deeper, more accurate insights.
Microsoft’s product team notes that Copilot reduces manual design time and helps analysts “move from visual creation to insight explanation faster than ever.”
What dashboards does Microsoft recommend for business success?
Microsoft Learn highlights core dashboard categories to measure organizational performance:
- Executive Insights Dashboard: track revenue, profitability, and strategic KPIs.
- Sales Analytics Dashboard: monitor pipeline performance using Power BI’s visual filters.
- Finance Dashboard: connect to Excel or Azure SQL Database for automated refreshes.
- Operations Dashboard: monitor supply chain or production metrics using real-time datasets.
- HR Analytics: evaluate workforce retention and engagement using Power Query transformations.
➜ More Info: 15 Power BI Examples
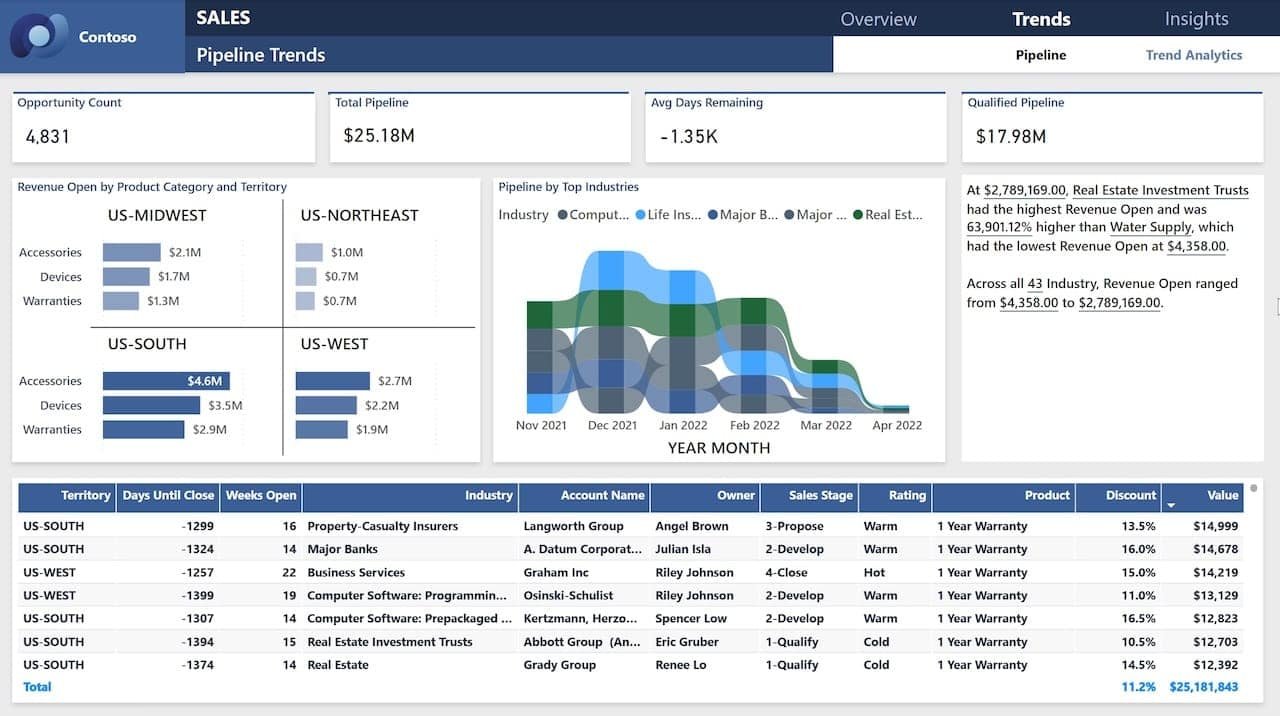
Top Power BI dashboards every business needs in 2026
| Dashboard Type | Key KPIs | 2026 Enhancement |
|---|---|---|
| Executive KPI | Margin %, Revenue, Growth | Real-time anomaly alerts via Copilot |
| Sales & Pipeline | Win rate, Average deal size | Predictive forecasting |
| Financial | P&L, Cash flow, Opex | Automated month-end close |
| Operations | Inventory, Lead times | IoT-linked real-time views |
| Marketing | ROI, CPC, Conversion rate | Attribution modelling |
| HR & People | Retention, Engagement score | Sentiment analytics |
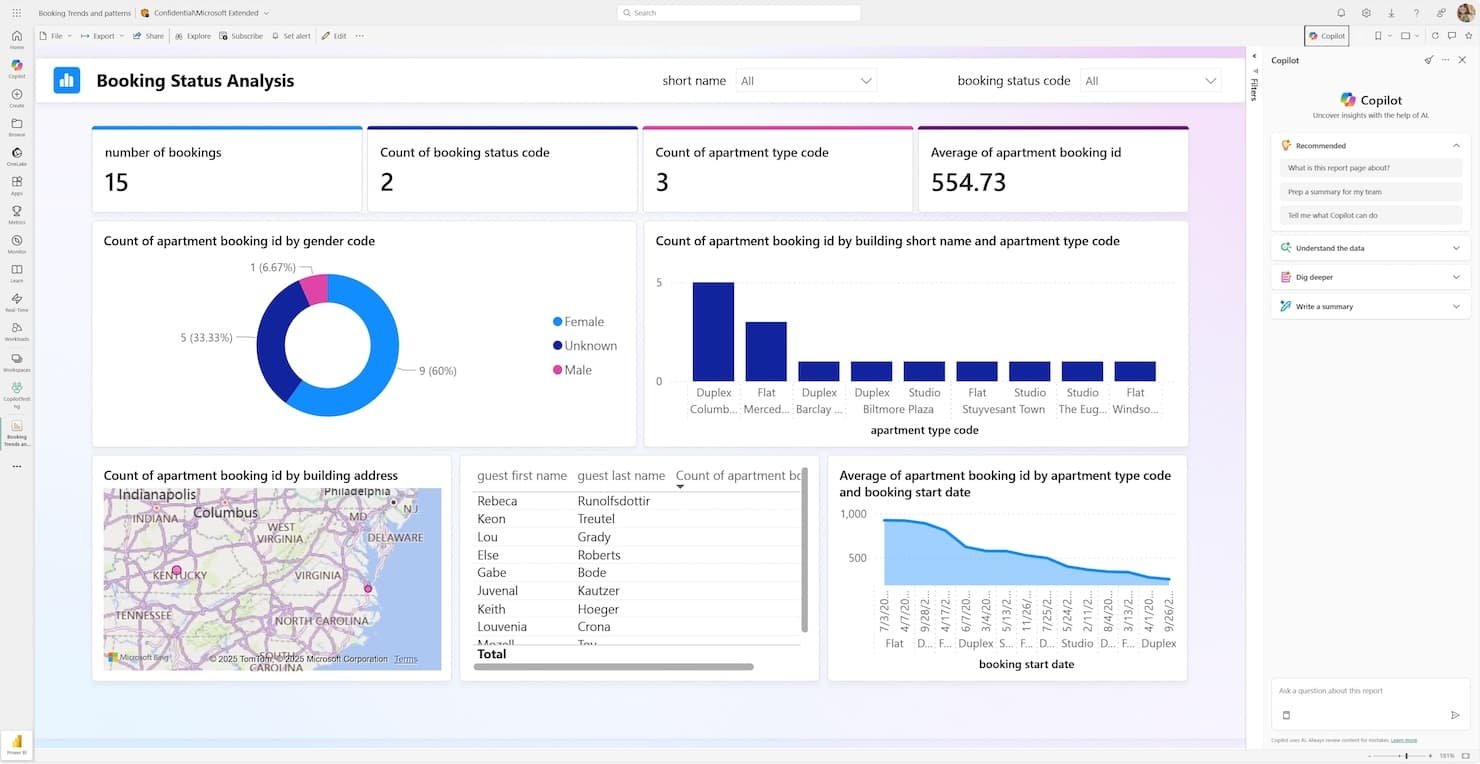
How to implement Power BI effectively — a 90-day rollout plan (guideline)
Microsoft’s Power BI Adoption Roadmap recommends a structured rollout:
Phase 1 (Weeks 1–2): Define and Discover
- Establish an executive sponsor and business objectives.
- Identify initial data sources and governance owners.
- Identify business goals and KPIs
- Audit data sources (ERP, CRM, spreadsheets, cloud)
Phase 2 (Weeks 3–6): Model and Build
- Deploy workspaces and assign roles (Viewer, Contributor, Admin).
- Configure data gateways, permissions and refresh schedules.
- Develop your first high-impact dashboard
Phase 3 (Weeks 7–9): Deploy and Deliver Value
- Build pilot dashboards in Power BI Service.
- Publish to Power BI Service
- Enable Copilot and Q&A for self-service insights.
Phase 4 (Weeks 10/12) Drive Adoption
- Track usage metrics with built-in reports (views, unique users, shares).
- Optimize datasets and evaluate Premium capacity
- Train business users to interpret insights
➜ More Info: Microsoft Fabric Adoption Roadmap
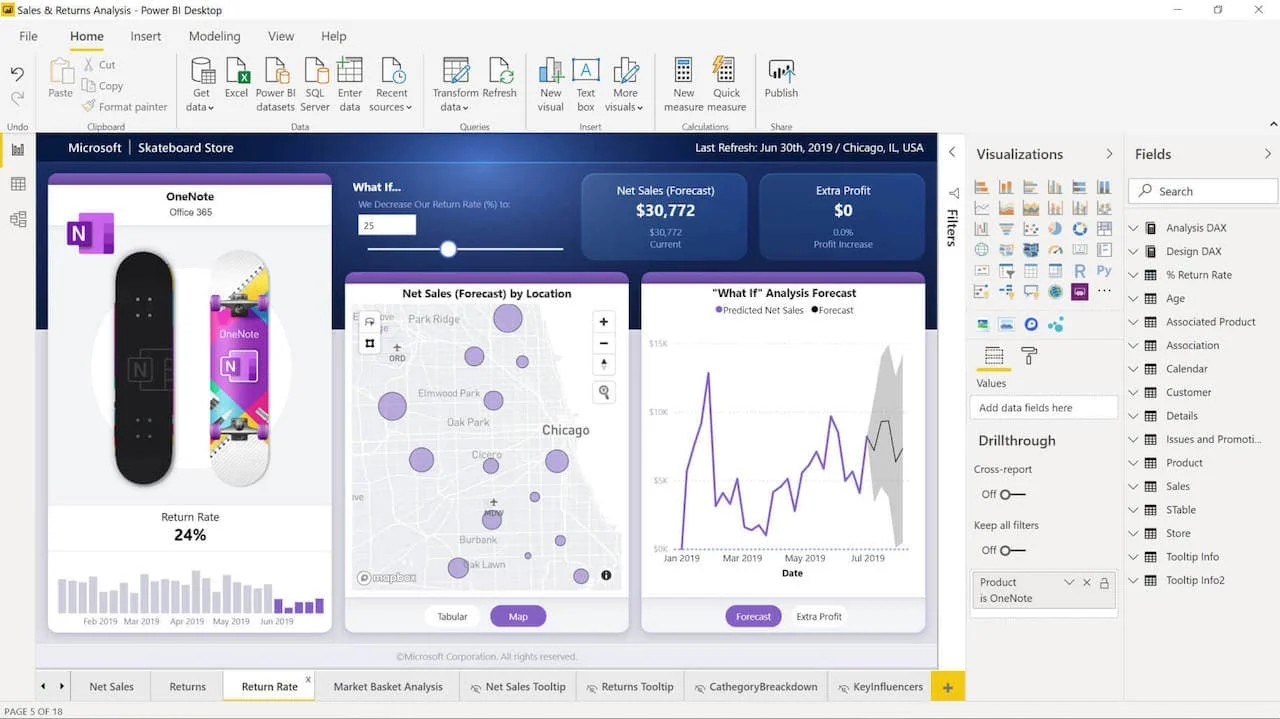
Which metrics should you track for ROI?
Power BI performance isn’t about dashboard count — it’s about business impact. Microsoft includes built-in usage metrics reports in Power BI Service.
These show:
- Views per report
- Unique viewers
- Shares per day
- Workspace-level usage
Tracking these KPIs allows IT Managers to measure adoption, identify under-used content, and guide training needs, key factors in maximizing Power BI ROI.
Power BI vs Fabric Dataflows, which to use when?
Microsoft clarifies that in 2026, Power BI Dataflows Gen2 are now part of Microsoft Fabric.
Use Dataflows for:
- Data transformation and reusability across workspaces
- Centralized governance of refresh schedules
Use Microsoft Power BI Desktop for:
- Data modelling and DAX development
- Visual design and publishing
Power BI vs Tableau in 2026: Which delivers more value?
| Feature | Power BI | Tableau |
|---|---|---|
| Cost | $14/user / month (Pro) | $70/user / month (Creator) |
| Integration | Microsoft 365 & Azure native | Vendor-neutral |
| AI & NLQ | Copilot + Q&A | Ask Data |
| Cloud Strategy | Deep Microsoft Fabric tie-in | Broader multi-cloud |
| Ideal For | Microsoft-centric enterprises | Multi-stack analytics shops |
Governance and licensing essentials (Microsoft 2025 guidance)
-
Licensing: Power BI Pro, user-based; Power BI Premium, capacity-based.
-
Dataset limits: Pro, 1 GB per dataset; Premium, larger datasets and incremental refresh.
-
Data Security: Use sensitivity labels and Microsoft Purview Data Loss Prevention.
-
Governance: Adopt workspace lifecycle management and content certification.
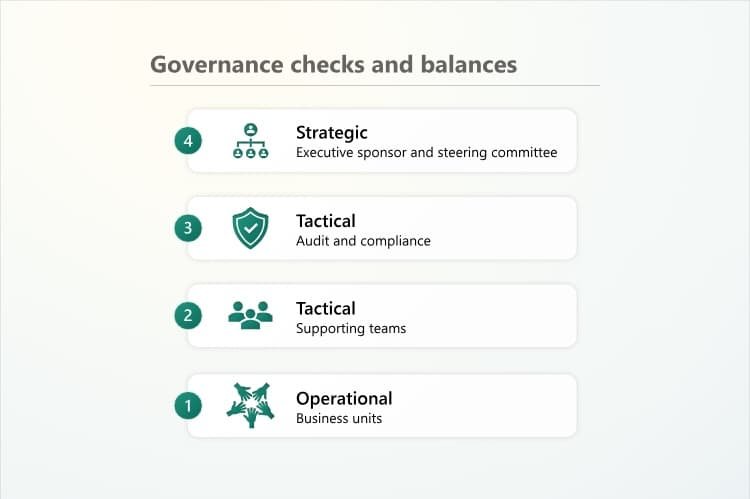
Don’t Make These Common Power BI Mistakes
Here are some common mistakes to avoid, based on Hako IT experts’ experience:
- Building visuals before defining business questions
- Ignoring data modeling best practices (single star schema preferred).
- Overloading dashboards with visuals
- Over-filtering visuals leading to slow performance.
- Using import mode for massive datasets instead of DirectLake.
- Skipping user adoption and training
- Neglecting workspace security roles.
- Failing to monitor refresh and dataset size limits.
- Neglecting usage metrics

What skills Microsoft recommends for Power BI professionals
Microsoft identifies five key skill areas:
- Data Modelling – relationships, DAX, and semantic models.
- Data Preparation – Power Query and M language.
- Visualization Design – effective chart and report design principles.
- AI Integration – using Copilot and Q&A.
- Governance & Security – Purview, workspace roles, and row-level security.
➜ More Info: Microsoft Learn – Power BI Learning Path
Copilot Power BI Example:
Future of Power BI (2025 → 2026)
Microsoft’s Fabric roadmap outlines major directions:
- Deeper integration with Microsoft Fabric Data Engineering and Real-Time Analytics.
- Expansion of Copilot to automatically create data models and summaries.
- Native integration with Microsoft Teams for collaborative data chats.
- Enhanced governance APIs for automated content management.
Power BI Copilot DEMO (Video)
FAQs How to Use Microsoft Power BI Effectively
Do I need DAX skills to use Power BI effectively?
For basic analysis, Copilot and Q&A are enough. For complex models, Microsoft recommends learning DAX fundamentals.
What is the difference between Power BI Pro and Premium?
Pro is licensed per user; Premium offers dedicated capacity, larger datasets, and enhanced AI features.
How do I monitor dashboard usage?
Use Power BI Service’s usage metrics report to track views, users, and engagement.
Can Power BI handle real-time data?
Yes, via DirectLake and streaming datasets in Fabric Real-Time Analytics.
Where can I learn Power BI best practices?
Microsoft Learn offers structured modules and certifications (PL-300 and PL-600).
Conclusion – Next Steps with HAKO IT
To use Power BI effectively in 2026, follow Microsoft’s proven roadmap:
- Adopt Fabric and Copilot for end-to-end analytics.
- Implement governance from day one using Purview and workspace roles.
- Track usage metrics and retire unused dashboards monthly.
- Invest in training via Microsoft Learn and certified partners.
HAKO IT specialized in Power BI deployment, governance, and AI integration. We help organizations accelerate adoption with a structured 90-day implementation plan aligned to Microsoft best practices.
Power BI Tutorials: Unlock the Power of Data!
Check out these must-see beginner tutorials and start transforming data into insights today! Get step-by-step guidance, tips, and tricks to master Power BI like a PRO 👨💻👩💻:
Microsoft Power BI – A Comprehensive Introduction
Create a Report in 60 Seconds with Power BI | Power BI Tutorial
How to use Power BI Embedded – Tutorial Step by step | Microsoft Power BI


